Macular OCT Imaging in Glaucoma
All content on Eyewiki is protected by copyright law and the Terms of Service. This content may not be reproduced, copied, or put into any artificial intelligence program, including large language and generative AI models, without permission from the Academy.
Macular OCT imaging of the ganglion cell and surrounding layers has shown promise in early diagnosis and screening of glaucoma where other changes may not be apparent. It is comparable to OCT-based peri-papillary RNFL analysis in predicting risk of glaucoma development and should be used in conjunction with RNFL measurement for maximum diagnostic yield.
Disease Entity
Glaucoma is an irreversible progressive optic neuropathy involving damage to retinal ganglion cells resulting in gradual visual field loss. It is a multifactorial disease, with several distinct pathophysiologies resulting in the same clinical syndrome of progressive optic neuropathy.[1] Vision loss in glaucoma is characteristically insidious and begins with peripheral visual field involvement.
Etiology
The three major types of adult glaucoma are primary open angle glaucoma, normal tension glaucoma and angle closure glaucoma. Secondary glaucomas account for approximately 10% of all glaucoma sub-types. Secondary glaucomas result from secondary factors that decrease aqueous drainage and can present with an open or closed angle. The three main types of secondary glaucoma include neovascular glaucoma, pseudoexfoliation syndrome, and pigmentary glaucoma.
Risk Factors
Risk factors for the development of primary open-angle glaucoma include elevated IOP, age, family history, African race, myopia, thin central corneal thickness, and systemic perfusion pressure.[2]
Diagnosis
Historically, screening for and diagnosis of glaucoma has relied on measurement of IOP, assessment of visual fields, and fundus biomicroscopy. However, visual field loss is not always apparent until later stages of the disease[3]and IOP is not adequately sensitive or specific for screening purposes.[4]Alterations in the appearance of the retina and optic disc may be visible on exam, including changes to the neuroretinal rim and increased optic cup-to-disk ratio. Defects in the retinal nerve fiber layer can be an early sign of glaucoma before other changes are visible. However, visible changes in appearance on exam are not always apparent or are non-specific.[1]
Diagnostic procedures
Optical coherence tomography (OCT) is an imaging modality first developed in the early 1990s. It uses light beams and their pattern of back-scattering to build high resolution cross-sectional images of the retina and optic nerve. This allows for rapid imaging of living tissue with micron-level resolution to depths of several millimeters without any ionizing radiation. OCT quickly found applications in ocular imaging, particularly in the assessment of retinal disease and optic nerve pathology.
The two primary modalities of OCT are time domain (TD) and spectral domain (SD).[5] TD analyzes interference patterns over time to generate an image, while SD incorporates a spectrometer to increase scanning time. SD has the advantage of being able to acquire images more quickly than TD, allowing for more detailed imaging.
OCT Imaging in Glaucoma
The three primary FDA approved modalities of OCT are time domain (TD), spectral domain (SD) and swept source (SS).[5]TD analyzes interference patterns over time to generate an image while SD incorporates a spectrometer to conduct analysis over multiple wavelengths, with improved axial resolution and scan speed resulting in faster and denser sampling. SS-OCT sweeps across a narrow band of wavelengths with each scan, providing the highest axial depth, fastest image capture and best signal-to-noise ratios.
OCT imaging has assisted significantly in the screening, early diagnosis, and management of glaucoma. One of the early applications of OCT was assessment for glaucoma by optic nerve head (ONH) imaging. This allowed for measurement of the optic disc and surrounding retina, including peri-papillary retinal nerve fiber layer (RNFL) thickness and optic disc rim and cup sizes.[6]OCT assessment of these parameters permitted more accurate and reproducible measurement than through ophthalmoscopy, and has become a mainstay in glaucoma diagnosis and following disease progression.
Macular OCT Imaging
A newer application of OCT involves macular imaging to assess for glaucoma. Overall macular thickness, asymmetry between the eyes and progression over time, can be used as a metric for glaucoma diagnosis. Arcuate patterns of RNFL loss may also be seen extending from the macula toward the ONH.[7]
More recently, OCT imaging of the macula has focused on assessment of the thickness of the ganglion cell layer, which is known to be damaged early in the progression of glaucoma. Because of the difficulty in precisely distinguishing macular layers, OCT measurements for macular analysis come either in the form of the combined ganglion cell and inner plexiform layers (GCIPL), or as the “ganglion cell complex” (GCC), which also includes the RNFL.[8]Whereas previous generations of OCT relied on TD and did not have the resolution to accurately analyze macular layers, newer SD- and SS-OCTs permit this level of analysis. All OCT machines today can provide maps of total macular thickness and cross-sectional images. Most devices can also provide maps of ganglion cell analysis specifically.
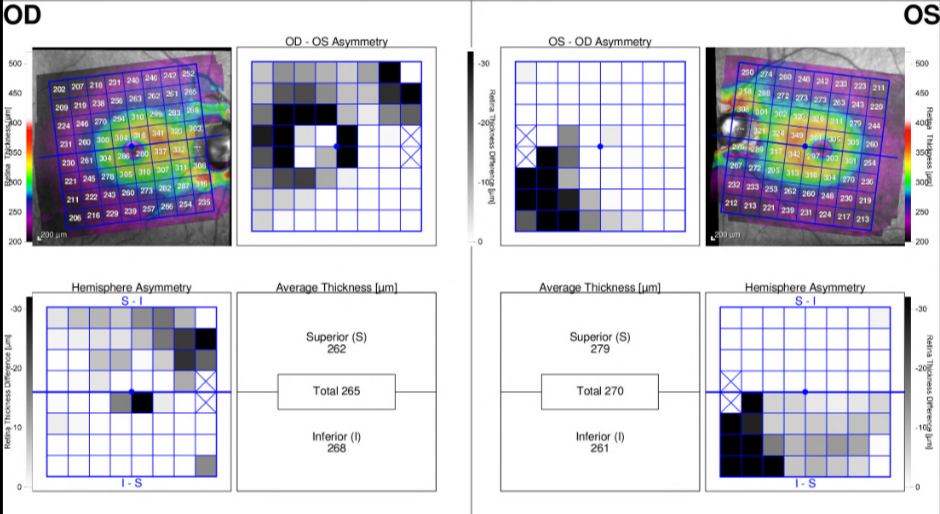
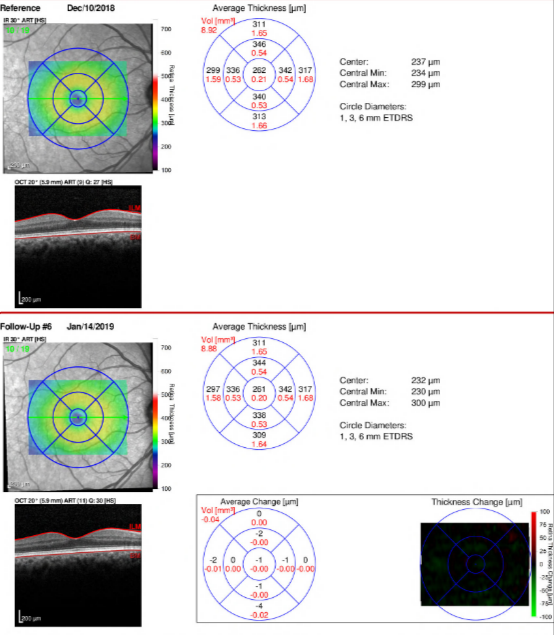
In general, recent studies have shown that OCT assessment of ganglion cell thickness is at least as accurate as RNFL thickness in diagnosing glaucoma.[9] [10] [11] Still, diagnosis remains easier in more advanced cases of glaucoma. It has been suggested that macular changes may appear earlier and more consistently in glaucoma than RNFL changes, implying that macular OCT could be a more sensitive tool for glaucoma screening.[12]In addition, in some cases where changes to the RNFL are not apparent, macular measurement is a superior diagnostic indicator.[13]However, at least one study that directly compared the utility of ganglion cell versus peri-papillary RNFL thickness for glaucoma diagnosis found RNFL thickness to be superior.[14]Practically speaking, one distinct advantage of macular versus ONH OCT is that the former does not require the patient to move their eyes and thus is both an easier image to obtain and tends to be of higher quality.[8] Most OCT models now include macular imaging and measurements, in addition to the standard ONH parameters. An example of the report for the Spectralis (Heidelberg Engineering, Inc., Headelberg, Germany) macular OCT with Asymmetry Analysis and Thickness Change Map is provided below. Deep learning can be used to assess macular OCT scans in order to predict glaucomatous visual field defects.[15]
Currently, the combination of RNFL and ganglion cell analysis is generally considered the best approach to OCT-based glaucoma assessment.[8][16]In one study, a composite index that included GCC volume loss, inferior RNFL thickness, age, and visual field loss was better than any single factor in predicting glaucoma development after six years.[11] Some studies have elucidated this point further through the usage of multivariable analysis to create predictive models for early stage glaucoma detection.[17]
Thus far, studies have utilized machine-learning algorithms to detect early glaucomatous changes in standard color fundus photos.[18] In the future, utilizing machine learning software to evaluate objective measurements from macular OCT may further assist clinicians in establishing early diagnosis of glaucoma in patients with structural changes prior to the onset of detectable visual field loss.
Figure 1: Spectralis Macular OCT with Asymmetry Analysis in a patient with POAG
(Spectralis, Heidelberg Engineering, Inc., Heidelberg, Germany)
Courtesy of Dr. Ahmad Aref
Figure 2: Spectralis Macular OCT with Thickness Change Map in a patient with POAG
(Spectralis, Heidelberg Engineering, Inc., Heidelberg, Germany)
Courtesy of Dr. Ahmad Aref
References
- ↑ Jump up to: 1.0 1.1 Bowling B. Chapter 10 – Glaucoma. Kanski’s Clin Ophthalmol 2016:305–394.
- ↑ Myron Yanoff, Jay S. Duker. Ophthalmology. 4th ed. Elselvier; 2014.
- ↑ Hart WM, Becker B. The onset and evolution of glaucomatous visual field defects. Ophthalmology 1982;89:268–79. Available at: http://www.ncbi.nlm.nih.gov/pubmed/7088510 [Accessed January 4, 2018].
- ↑ Tielsch JM, Katz J, Singh K, et al. A population-based evaluation of glaucoma screening: the Baltimore Eye Survey. Am J Epidemiol 1991;134:1102–10. Available at: http://www.ncbi.nlm.nih.gov/pubmed/1746520 [Accessed January 4, 2018].
- ↑ Jump up to: 5.0 5.1 Duker JS, Waheed NK, Goldman D. Handbook of Retinal OCT: Optical Coherence Tomography. Saunders; 2014.
- ↑ Schuman JS, Hee MR, Puliafito CA, et al. Quantification of nerve fiber layer thickness in normal and glaucomatous eyes using optical coherence tomography. Arch Ophthalmol (Chicago, Ill 1960) 1995;113:586–96. Available at: http://www.ncbi.nlm.nih.gov/pubmed/7748128 [Accessed January 4, 2018].
- ↑ Gupta D, Asrani S. Macular thickness analysis for glaucoma diagnosis and management. Taiwan J Ophthalmol 2016;6:3–7. Available at: https://www.sciencedirect.com/science/article/pii/S2211505616000089#bib10 [Accessed January 5, 2018].
- ↑ Jump up to: 8.0 8.1 8.2 Ishikawa H. Where does ganglion cell analysis fit? Glaucoma Today 2016. Available at: http://glaucomatoday.com/2016/06/where-does-ganglion-cell-anaylsis-fit/ [Accessed January 4, 2018].
- ↑ Kim NR, Lee ES, Seong GJ, et al. Structure–Function Relationship and Diagnostic Value of Macular Ganglion Cell Complex Measurement Using Fourier-Domain OCT in Glaucoma. Invest Ophthalmol Vis Sci 2010;51:4646. Available at: http://www.ncbi.nlm.nih.gov/pubmed/20435603 [Accessed January 4, 2018].
- ↑ Sung M-S, Yoon J-H, Park S-W. Diagnostic Validity of Macular Ganglion Cell-Inner Plexiform Layer Thickness Deviation Map Algorithm Using Cirrus HD-OCT in Preperimetric and Early Glaucoma. J Glaucoma 2014;23:e144–e151. Available at: http://www.ncbi.nlm.nih.gov/pubmed/24240879 [Accessed January 4, 2018].
- ↑ Jump up to: 11.0 11.1 Zhang X, Loewen N, Tan O, et al. Predicting Development of Glaucomatous Visual Field Conversion Using Baseline Fourier-Domain Optical Coherence Tomography. Am J Ophthalmol 2016;163:29–37. Available at: http://www.sciencedirect.com/science/article/pii/S0002939415007321 [Accessed January 4, 2018].
- ↑ Arvanitaki V, Tsilimbaris MK, Pallikaris A, et al. Macular retinal and nerve fiber layer thickness in early glaucoma: clinical correlations. Middle East Afr J Ophthalmol 2012;19:204–10. Available at: http://www.ncbi.nlm.nih.gov/pubmed/22623860 [Accessed January 4, 2018].
- ↑ Sung KR, Wollstein G, Kim NR, et al. Macular assessment using optical coherence tomography for glaucoma diagnosis. Br J Ophthalmol 2012;96:1452–1455. Available at: http://www.ncbi.nlm.nih.gov/pubmed/23018425 [Accessed January 4, 2018].
- ↑ Na JH, Sung KR, Baek S, et al. Macular and Retinal Nerve Fiber Layer Thickness: Which Is More Helpful in the Diagnosis of Glaucoma? Invest Ophthalmol Vis Sci 2011;52:8094. Available at: http://www.ncbi.nlm.nih.gov/pubmed/21911590 [Accessed January 4, 2018].
- ↑ Mohammadzadeh V, Vepa A, Li C, Wu S, Chew L, Mahmoudinezhad G, Maltz E, Sahin S, Mylavarapu A, Edalati K, Martinyan J, Yalzadeh D, Scalzo F, Caprioli J, Nouri-Mahdavi K. Prediction of Central Visual Field Measures From Macular OCT Volume Scans With Deep Learning. Transl Vis Sci Technol. 2023 Nov 1;12(11):5. doi: 10.1167/tvst.12.11.5. PMID: 37917086; PMCID: PMC10627306.
- ↑ Ashley Speilburg OF, Michael Chaglasian OF. How macular OCT scanning affects glaucoma evaluation. Optom Times 2016. Available at: http://optometrytimes.modernmedicine.com/optometrytimes/news/how-macular-oct-scanning-affects-glaucoma-evaluation?page=0,1 [Accessed January 4, 2018].
- ↑ Tatham AJ, Medeiros FA. Detecting Structural Progression in Glaucoma with Optical Coherence Tomography. Ophthalmology. 2017;124(12S):S57-S65. Available at: https://www.ncbi.nlm.nih.gov/pmc/articles/PMC6882427/ [Accessed July 10, 2020].
- ↑ Bajwa MN, Malik MI, Siddiqui SA, et al. Two-stage framework for optic disc localization and glaucoma classification in retinal fundus images using deep learning. BMC Med Inform Decis Mak. 2019;19(1):136. Available at: https://pubmed.ncbi.nlm.nih.gov/31315618/ [Accessed July 10, 2020]


